%%{init: {"theme":"base","themeVariables":{"primaryColor":"#EAF2FB","primaryBorderColor":"#2780E3","primaryTextColor":"#212529","lineColor":"#6C757D","secondaryColor":"#EAF7E6","tertiaryColor":"#FFF4E8","fontSize":"13px"},"flowchart":{"nodeSpacing":18,"rankSpacing":24,"padding":6}}}%%

flowchart LR
    A["明确 LoB、LoD、LoQ<br/>或声明验证目标"] --> B["sensitivity_design()<br/>核对设计"]
    B --> C["sensitivity_lob()"]
    C --> D["sensitivity_lod()"]
    D --> E["sensitivity_loq()"]
    E --> F["sensitivity_verify()"]
    F --> G["检查方法、精密度轮廓<br/>和验证通过率"]

    classDef input fill:#EAF2FB,stroke:#2780E3,color:#212529
    classDef process fill:#EAF7E6,stroke:#3FB618,color:#212529
    classDef output fill:#F4EEFB,stroke:#9954BB,color:#212529
    class A input
    class B,C,D,E,F process
    class G output
16 检出限/定量限
本文围绕空白限(LoB)、检出限(LoD)、定量限(LoQ)及其声明验证,说明如何把低浓度实验数据转换为可审计的灵敏度结论。不同指标回答的问题不同:LoB 描述空白分布上界,LoD 描述检出能力,LoQ 还必须附带精密度或总误差要求。
分析流程:建立或验证 LoB、LoD、LoQ
代码
library(ivdtools)16.1 主要函数
分析灵敏度模块使用原始长数据作为主要输入,并将限值建立、声明验证和试验设计分开:
| 函数 | 用途 |
|---|---|
sensitivity_lob() |
非参数、参数或零 LoB 建立 |
sensitivity_lod() |
经典、非参数试验、精密度曲线或 Probit LoD |
sensitivity_loq() |
Westgard、RMS、精密度或自定义目标 LoQ |
sensitivity_verify() |
验证已有 LoB、LoD 或 LoQ 声明 |
sensitivity_design() |
查看最低设计要求和实际数据计数 |
16.1.1 建立函数、参数与核心统计量
代码
sensitivity_lob(
  data, result, sample, lot = NULL,
  method = c("nonparametric", "parametric", "zero"),
  alpha = 0.05, lot_rule = c("ep17", "separate", "combined"),
  exclude = NULL
)
sensitivity_lod(
  data, result = NULL, sample = NULL, lob, lot = NULL,
  concentration = NULL, detected = NULL,
  method = c("classical", "nonparametric", "profile", "probit"),
  beta = 0.05, profile_model = c("linear", "quadratic", "sadler", "vfp")
)
sensitivity_loq(
  data, result, sample, assigned, lot = NULL,
  method = c("westgard", "rms", "precision", "custom"),
  goal, goal_scale = c("relative", "absolute"),
  lod = NULL, k = 2, profile = FALSE
)
非参数 LoB 是空白结果的 \(1-\alpha\) 秩分位数;参数法使用
\[ LoB=\bar x_B+c_p s_B, \]
其中 \(c_p\) 根据 \(\alpha\) 和空白自由度 \(B-K\) 作有限样本修正。method="zero" 固定 \(LoB=0\),并报告空白大于零的比例。经典 LoD 对多个低水平样本先按自由度合并 SD:
\[ s_p=\sqrt{\frac{\sum_j(n_j-1)s_j^2}{\sum_j(n_j-1)}}, \]
再结合 LoB、\(\beta\) 和有限样本修正得到检出限。精密度轮廓法求解浓度相关 SD,Probit 法则 拟合检测概率—浓度关系;两者的数据结构和假设不同。
LoQ 的逐水平偏差 \(b=\bar x-x_a\)。四种误差量为:
method |
与 goal 比较的原始量 |
|---|---|
westgard |
\(|b|+k s\) |
rms |
\(\sqrt{s^2+b^2}\) |
precision |
\(s\) |
custom |
accuracy_function() 返回值 |
goal_scale="relative" 时再除以 \(|x_a|\)。候选 LoQ 是满足目标的最低观测均值或拟合轮廓交点; 多批按所选 lot_rule 处理,最终取最保守的有限候选值。提供 LoD 时 \(LoQ_{\mathrm{reported}}=\max(LoQ_{\mathrm{candidate}},LoD)\)。
sensitivity_lob()、sensitivity_lod() 和 sensitivity_loq() 返回对应限值、方法、核心统计量和诊断信息。
16.1.2 声明验证和设计检查
代码
sensitivity_verify(
  data, result, sample, limit = c("lob", "lod", "loq"),
  claim, lob = NULL, assigned = NULL, allowable_error = NULL,
  error_scale = c("relative", "absolute"), alpha = 0.05
)
sensitivity_design(method = "all", data = NULL, ...)
LoB 验证统计 \(x\le claim\),LoD 验证统计 \(x\ge LoB\),LoQ 验证统计结果是否在赋值允许误差窗内。 函数输出观察成功比例、单侧 Wilson score 区间以及 EP17 表 1 边界,但故意不生成 pass 字段。 sensitivity_design() 给出最低设计要求并可汇总实际数据计数;它只显示差距,不替代方案判定。
sensitivity_verify() 返回观察成功比例、Wilson 区间和边界信息;sensitivity_design() 返回最低要求与实际计数表。
16.2 分析案例
16.2.1 LoB
原始数据每行是一条测量结果:
代码
# 模拟数据
set.seed(17)
blank <- expand.grid(
  lot = c("A", "B"), sample = paste0("blank", 1:4), replicate = 1:15
)
blank$result <- rnorm(nrow(blank), 0.2, 0.1)
head(blank, 6)
lot sample replicate result
1 A blank1 1 0.09849913
2 B blank1 1 0.19203633
3 A blank2 1 0.17670130
4 B blank2 1 0.11827321
5 A blank3 1 0.27720908
6 B blank3 1 0.18343881代码
# lob 建立
lob_np <- sensitivity_lob(
  blank, result = "result", sample = "sample", lot = "lot",
  method = "nonparametric"
)
lob_np
Analytical sensitivity: LOB
Method: nonparametric
Estimate: 0.378828 EP17 批号规则默认用于全部建立函数:2~3 批分别计算并取最大值,4 批及以上合并计算。负测量结果不会被自动截断为 0。
16.2.2 LoD
经典 LoD 使用低水平样本的合并 SD:
代码
# 模拟数据
low <- expand.grid(
  lot = c("A", "B"), sample = paste0("low", 1:4), replicate = 1:15
)
low$result <- rnorm(nrow(low), 1.2, 0.2)
head(low, 6)
lot sample replicate result
1 A low1 1 1.4763513
2 B low1 1 1.2897865
3 A low2 1 1.1695380
4 B low2 1 1.2518588
5 A low3 1 0.8777197
6 B low3 1 0.7982088代码
# lod 建立
lod_classical <- sensitivity_lod(
  low, result = "result", sample = "sample", lot = "lot",
  lob = lob_np, method = "classical"
)
lod_classical
Analytical sensitivity: LOD
Method: classical
Estimate: 0.771614 method = "profile" 支持 linear、quadratic、sadler 和 vfp 精度轮廓;method = "probit" 支持原始 0/1 检测结果或命中数/总数汇总数据。Cochran 统计量和拟合指标只作为诊断信息,不由程序代替用户选择分析路径。
16.2.3 LoQ
LoQ 的准确度目标必须预先给定。相对目标使用比例,例如 21.6% 写作 0.216:
代码
# 模拟数据
loq_data <- expand.grid(
  lot = c("A", "B"), sample = paste0("pool", 1:4), replicate = 1:9
)
loq_data$assigned <- rep(rep(c(30, 35, 40, 45), each = 9), 2)
loq_data$result <- rnorm(nrow(loq_data), loq_data$assigned,
                         0.06 * loq_data$assigned)
head(loq_data, 6)
lot sample replicate assigned result
1 A pool1 1 30 29.70842
2 B pool1 1 30 28.62287
3 A pool2 1 30 29.82049
4 B pool2 1 30 30.07043
5 A pool3 1 30 28.84843
6 B pool3 1 30 28.98056代码
# loq 建立
loq_te <- sensitivity_loq(
  loq_data, result = "result", sample = "sample", assigned = "assigned",
  lot = "lot", method = "westgard", goal = 0.216,
  goal_scale = "relative", lod = lod_classical
)
loq_te
Analytical sensitivity: LOQ
Method: westgard
Estimate: 29.4924
Candidate LoQ: 29.4924
Reported LoQ : 29.4924 结果同时保存 candidate_loq 与 reported_loq,因此 LoD 约束不会覆盖原始候选值。
16.2.4 声明验证
limit 每次只能指定一种声明:
代码
# 模拟数据
verification <- data.frame(
  sample = rep(c("blank1", "blank2"), each = 10),
  result = c(rep(0, 19), 1.2)
)
head(verification, 6)
sample result
1 blank1 0
2 blank1 0
3 blank1 0
4 blank1 0
5 blank1 0
6 blank1 0代码
# lob 验证
v_lob <- sensitivity_verify(
  verification, result = "result", sample = "sample",
  limit = "lob", claim = 1
)
v_lob
Analytical sensitivity: VERIFICATION
Method: lob
Limit : lob
Claim : 1
LoB : 1
Total results : 20
Consistent results : 19
Observed proportion : 0.95
Score CI lower : 0.80399276
Score CI upper : 0.98876518
EP17 boundary : 0.85
Difference from boundary : 0.1- LoB:统计
result <= claim。 - LoD:统计
result >= lob;LoD 声明值不是检测判定阈值。 - LoQ:统计结果是否落入各样本赋值的允许误差窗口。
结果包含观察比例、单侧 Wilson score 区间、EP17 Table 1 边界及差值,不包含 pass 或 verified 字段。
16.2.5 试验设计
代码
sensitivity_design("all")Analytical sensitivity study design
Method: classical
Reagent lots : 2
Instruments : 1
Days : 3
Blank samples : 4
Low samples : 4
Concentration levels : NA
Replicates per lot : 60
Replicate scope : blank and low results separately
Method: profile
Reagent lots : 2
Instruments : 1
Days : 5
Blank samples : 0
Low samples : 5
Concentration levels : 5
Replicates per lot : 40
Replicate scope : per sample
Method: probit
Reagent lots : 2
Instruments : NA
Days : NA
Blank samples : 0
Low samples : 3
Concentration levels : 5
Replicates per lot : 20
Replicate scope : per sample and concentration level
Method: loq
Reagent lots : 2
Instruments : 1
Days : 3
Blank samples : 0
Low samples : 4
Concentration levels : 1
Replicates per lot : 36
Replicate scope : total low results
Method: verification
Reagent lots : 1
Instruments : 1
Days : 3
Blank samples : 2
Low samples : 0
Concentration levels : 1
Replicates per lot : 20
Replicate scope : total verification results代码
sensitivity_design("verification", verification,
                   result = "result", sample = "sample", limit = "lob")
Analytical sensitivity study design
Method : verification
Reagent lots : 1
Instruments : 1
Days : 3
Blank samples : 2
Low samples : 0
Concentration levels : 1
Replicates per lot : 20
Replicate scope : total verification results
Observed study counts
Observations : 20
Reagent lots : NA
Days : NA
Samples : 2
Concentration levels : NA设计对象并列报告最低要求与实际计数,但不作通过或不通过结论。排除记录必须通过 exclude 显式传入,并会保存在结果对象中。
16.2.6 标准案例:CLSI EP17-A2 附录 A:经典法 LoB 和 LoD
两批试剂各有 60 个空白和 60 个低水平结果。按 EP17 的批号规则分别计算后取较大值。
代码
ep17_blank <- read.csv("./data/016-分析灵敏度/std-ep17-appendix-a-blank.csv", check.names = FALSE)
ep17_low <- read.csv("./data/016-分析灵敏度/std-ep17-appendix-a-low.csv", check.names = FALSE)

ep17_lob_np <- sensitivity_lob(
  ep17_blank, result = "result", sample = "sample", lot = "lot",
  method = "nonparametric"
)
ep17_lod_np <- sensitivity_lod(
  ep17_low, result = "result", sample = "sample", lot = "lot",
  lob = ep17_lob_np, method = "classical"
)
ep17_lob_p <- sensitivity_lob(
  ep17_blank, result = "result", sample = "sample", lot = "lot",
  method = "parametric"
)
ep17_lod_p <- sensitivity_lod(
  ep17_low, result = "result", sample = "sample", lot = "lot",
  lob = ep17_lob_p, method = "classical"
)| 标准位置 | 统计量 | 标准结果 | ivdtools结果 |
|---|---|---|---|
| EP17-A2 Appendices A | nonparametric LoB lot 1 | 7.6 | 7.6000 |
| EP17-A2 Appendices A | nonparametric LoB lot 2 | 9.4 | 9.4000 |
| EP17-A2 Appendices A | nonparametric LoB report | 9.4 | 9.4000 |
| EP17-A2 Appendices A | classical LoD lot 1 | 14.5 | 14.5309 |
| EP17-A2 Appendices A | classical LoD lot 2 | 13.8 | 13.8343 |
| EP17-A2 Appendices A | classical LoD report | 14.5 | 14.5309 |
| EP17-A2 Appendices A | parametric LoB report | 8.8 | 8.7956 |
| EP17-A2 Appendices A | parametric LoD report | 13.9 | 13.9266 |
负测量结果按原表保留,未截断为 0。
16.2.7 标准案例:CLSI EP17-A2 附录 C:Probit LoD
零浓度的三批 66 次结果全部阴性,支持本案例 LoB = 0。对数浓度拟合时零浓度不能取对数, 因此只将阳性浓度行送入 Probit 模型;零浓度计数仍保留在输入表中供 LoB 核对。
代码
ep17_probit <- read.csv("./data/016-分析灵敏度/std-ep17-appendix-c-probit.csv", check.names = FALSE)
ep17_probit_fit_data <- ep17_probit[ep17_probit$concentration > 0, ]

ep17_c_lod <- sensitivity_lod(
  ep17_probit_fit_data,
  result = "positive", sample = "sample", lob = 0, lot = "lot",
  concentration = "concentration", detected = "positive", total = "total",
  method = "probit", concentration_scale = "log10"
)
plot(ep17_c_lod)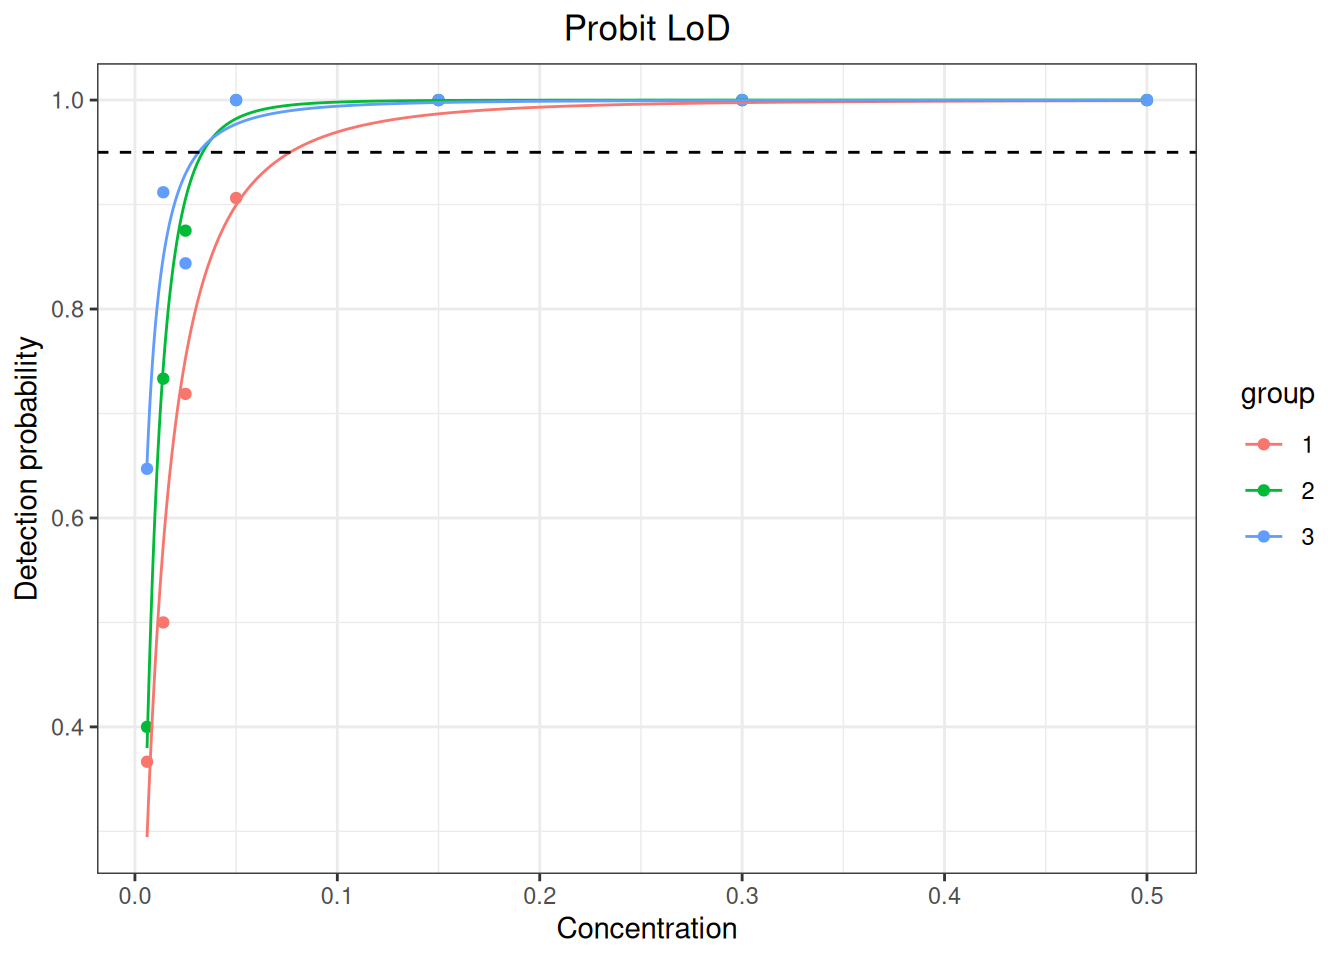
| 标准位置 | 统计量 | 标准结果 | ivdtools结果 |
|---|---|---|---|
| EP17-A2 Appendix C | Probit LoD lot 1 | 0.077 | 0.0766 |
| EP17-A2 Appendix C | Probit LoD lot 2 | 0.033 | 0.0335 |
| EP17-A2 Appendix C | Probit LoD lot 3 | 0.031 | 0.0314 |
三批 LoD 分别为 0.077、0.033 和 0.031 CFU/mL;取最大值得报告 LoD 0.077 CFU/mL。两类拟合优度检验均未提示失拟,但本附录仅使用 1 个样品,是标准为简化示例而明确偏离最低 3 个样品要求的设计,不能当作合规研究模板。
16.2.8 标准案例:CLSI EP17-A2 附录 E、F:声明验证
代码
ep17_ef <- read.csv("./data/016-分析灵敏度/std-ep17-appendix-e-verification.csv", check.names = FALSE)
ep17_f <- read.csv("./data/016-分析灵敏度/std-ep17-appendix-f-loq-verification.csv", check.names = FALSE)

ep17_verify_lob <- sensitivity_verify(
  ep17_ef[ep17_ef$type == "blank", ],
  result = "result", sample = "sample", limit = "lob", claim = 20
)
ep17_verify_lod <- sensitivity_verify(
  ep17_ef[ep17_ef$type == "positive", ],
  result = "result", sample = "sample", limit = "lod", claim = 45,
  lob = 20
)
ep17_verify_loq <- sensitivity_verify(
  ep17_f, result = "result", sample = "sample", limit = "loq", claim = 50,
  assigned = "target", allowable_error = 0.15
)| 标准位置 | 统计量 | 标准结果 | ivdtools结果 |
|---|---|---|---|
| EP17-A2 Appendices E-F | LoB consistency (%) | 95.8 | 95.8333 |
| EP17-A2 Appendices E-F | LoD consistency (%) | 91.7 | 91.6667 |
| EP17-A2 Appendices E-F | LoQ consistency (%) | 91.1 | 91.1111 |
16.2.9 标准案例:YY/T 1789.3—2022 附录 A ProGRP
附录 A 给出两批试剂各 60 个空白结果和 60 个低浓度结果,适合直接使用 sensitivity_lob() 与 sensitivity_lod()。原表中的负空白值原样保留,不截断为零。
代码
yyt1789_3_blank <- read.csv(
  "./data/016-分析灵敏度/std-yyt1789-3-appendix-a-blank.csv"
)
yyt1789_3_low <- read.csv(
  "./data/016-分析灵敏度/std-yyt1789-3-appendix-a-low.csv"
)

yyt1789_3_lob_np <- sensitivity_lob(
  yyt1789_3_blank, result = "result", sample = "sample", lot = "lot",
  method = "nonparametric"
)
yyt1789_3_lob_p <- sensitivity_lob(
  yyt1789_3_blank, result = "result", sample = "sample", lot = "lot",
  method = "parametric"
)
yyt1789_3_lod_classical <- sensitivity_lod(
  yyt1789_3_low, result = "result", sample = "sample", lot = "lot",
  lob = yyt1789_3_lob_np, method = "classical"
)
yyt1789_3_lod_np <- sensitivity_lod(
  yyt1789_3_low, result = "result", sample = "sample", lot = "lot",
  lob = yyt1789_3_lob_np, method = "nonparametric"
)| 标准位置 | 统计量 | 标准结果 | ivdtools结果 |
|---|---|---|---|
| YY/T 1789.3 Appendix A | nonparametric LoB lot 1 | 0.240 | 0.2450 |
| YY/T 1789.3 Appendix A | nonparametric LoB lot 2 | 0.250 | 0.2500 |
| YY/T 1789.3 Appendix A | reported LoB | 0.250 | 0.2500 |
| YY/T 1789.3 Appendix A | parametric LoB lot 1 | 0.174 | 0.1758 |
| YY/T 1789.3 Appendix A | parametric LoB lot 2 | 0.176 | 0.1779 |
| YY/T 1789.3 Appendix A | classical LoD lot 1 | 0.350 | 0.3570 |
| YY/T 1789.3 Appendix A | classical LoD lot 2 | 0.360 | 0.3673 |
| YY/T 1789.3 Appendix A | nonparametric LoD lot 1 | 1.075 | 1.0750 |
| YY/T 1789.3 Appendix A | nonparametric LoD lot 2 | 1.130 | 1.1300 |
中间量存在3处必须披露的算法差异:
- 标准的非参数 LoB 直接取第 57 位,包使用连续秩 57.5 并在第 57、58 位之间插值,所以批 1 为 0.245 而不是 0.24;两批取较大值后报告值恰好仍为 0.25。
- 标准表 A.6 使用显示的合并 SD 0.065/0.066 和系数 1.653,得到经典 LoD 0.35/0.36;包从原始结果计算合并 SD,并采用自身有限样本系数 1.6486,得到约 0.357/0.367。两者方法相近但不是逐项同一实现,不能仅因最终舍入接近就标为完全复现。
- 参数 LoB 也因有限样本系数口径得到约 0.1758/0.1779,而标准为 0.174/0.176。