%%{init: {"theme":"base","themeVariables":{"primaryColor":"#EAF2FB","primaryBorderColor":"#2780E3","primaryTextColor":"#212529","lineColor":"#6C757D","secondaryColor":"#EAF7E6","tertiaryColor":"#FFF4E8","fontSize":"13px"},"flowchart":{"nodeSpacing":18,"rankSpacing":24,"padding":6}}}%%

flowchart LR
    A["共同病例<br/>多个定量标记物"] --> B["roc() → auc()<br/>单标记物基线"]
    B --> C["mlr()<br/>Logistic 联合模型"]
    B --> G["auc_compare()<br/>配对 AUC 比较"]
    C --> G
    C --> D["系数与训练集 AUC"]
    C --> E["predict()<br/>新样本概率"]
    D --> F["独立验证<br/>区分度、校准、效用"]
    E --> F

    classDef input fill:#EAF2FB,stroke:#2780E3,color:#212529
    classDef process fill:#EAF7E6,stroke:#3FB618,color:#212529
    classDef output fill:#F4EEFB,stroke:#9954BB,color:#212529
    class A input
    class B,C,G,D,E process
    class F output
12 ROC 曲线与多元回归
本文在单标记物 ROC 的基础上,演示用多个标记物拟合二项 Logistic 回归、计算联合预测概率、绘制训练集 ROC,并对新样本预测。联合模型需要同时评价区分度、校准、临床效用和可推广性;AUC 增加只是其中一个方面。
重要使用边界
mlr() 拟合的是给定变量的未惩罚、主效应 Logistic 回归。当前 ivdtools 不进行变量筛选、非线性项自动构造、交互作用搜索、缺失值插补、共线性诊断、内部验证、校准评价、决策曲线、外部验证或模型更新。
mlr() 报告的联合 AUC 来自拟合模型所用的同一批数据,属于表观性能;其 Hanley–McNeil 区间也没有校正模型拟合和变量选择带来的乐观偏倚。predict() 给出的区间是模型系数不确定性所对应的平均预测概率置信区间,不是未来个体结局的预测区间。
多标记物工作流为:
代码
library(ivdtools)
library(readr)
12.1 主要函数
| 函数 | 主要用途 | 主要结果 |
|---|---|---|
roc() |
用多个标记物建立共同完整病例对象 | 标记物值、参考状态和单标记物方向 |
auc() |
建立单标记物性能基线 | 每列 AUC、Hanley–McNeil SE 和 CI |
mlr() |
拟合一个命名的多元 Logistic 模型 | 模型、系数、预测概率及训练集 ROC/AUC |
auc_compare() |
比较同一批受试者的两条 ROC 曲线 | AUC 差、SE、CI、z 和 P 值 |
predict() |
用已保存模型预测训练数据或新数据 | 概率、SE、CI 和固定 0.5 分类 |
plot() |
叠加原始标记物和联合模型 ROC | ggplot 图形 |
summary() |
汇总所有已执行的分析 | 单标记物及全部命名模型结果 |
roc()、auc() 的完整参数、方向、AUC 和区间公式见上一章。本章重点说明联合模型接口。
12.1.1 多元 Logistic 回归 mlr()
代码
mlr(x, cols = NULL, name = NULL, ...)| 参数 | 说明 |
|---|---|
x |
已执行 auc() 的 roc 对象。 |
cols |
进入模型的标记物列;NULL 使用对象中的全部标记物。 |
name |
唯一模型名;省略时依次生成 MLR01、MLR02 等。 |
... |
传给 stats::glm() 的其他参数,例如控制选项;模型公式和二项分布由函数固定。 |
令 \(Y_i\in\{0,1\}\),选择 \(p\) 个标记物后,当前函数建立
\[ \eta_i=\beta_0+\sum_{j=1}^{p}\beta_jx_{ij}, \qquad \pi_i=P(Y_i=1\mid\mathbf x_i) =\frac{\exp(\eta_i)}{1+\exp(\eta_i)}. \]
系数通过二项分布最大似然估计。对其他变量不变的条件下,\(x_j\) 每增加一个原始单位,阳性优势乘以
\[ \operatorname{OR}_j=\exp(\beta_j). \]
这不是风险比,也不表示因果效应。若变量单位很小或很大,应在建模前按照预设方案缩放,以便系数具有可解释单位。
函数公式固定为 reference_binary ~ x1 + x2 + ...,不会自动加入平方项、样条或交互项。roc() 已经按全部初始 cols 建立共同完整病例,因此 mlr(cols=...) 的子模型仍使用同一分析集。这有利于比较嵌套标记物组合,但不等于完成缺失数据处理。
拟合后用同一批病例的 \(\widehat\pi_i\) 建经验 ROC,方向固定为 geq,即预测概率越大越倾向阳性。联合 AUC 的 SE 和 95% CI 继续使用上一章的 Hanley–McNeil 单曲线公式。
每个模型保存在 mlr_results[[name]],主要字段为:
| 字段 | 含义 |
|---|---|
formula、cols |
实际公式和预测变量 |
fit、fit_summary |
glm 对象及其摘要 |
predicted |
训练集拟合概率 |
auc、auc_se、ci_lower、ci_upper |
训练集 AUC 及近似区间 |
roc_curve |
训练概率的完整 cutoff 指标表 |
返回更新后的 roc 对象;新模型保存在 mlr_results[[name]]。
警告AUC 增加不等于模型已经得到验证
单标记物和联合模型的 ROC 来自同一受试者,二者相关,应使用 auc_compare() 作配对比较。但是,训练集联合概率由同一批结局数据拟合,EP24 和 DeLong 都把输入评分当作既定值,不会校正模型拟合、变量选择或过拟合造成的乐观偏倚。因此配对 P 值不能代替内部验证、独立验证、校准和临床净获益评价。
12.1.2 配对 AUC 比较 auc_compare()
代码
auc_compare(
  x,
  curves,
  method = c("ep24", "delong"),
  conf.level = 0.95,
  rating_method = c("pearson", "kendall"),
  name = NULL
)| 参数 | 说明 |
|---|---|
x |
已完成相应 auc() 或 mlr() 分析的同一个 roc 对象。 |
curves |
恰好两个曲线名称,可以是原始标记物、命名 MLR,或两者各一个;差值方向为第一个减第二个。 |
method |
默认 "ep24",使用 EP24-A2 Hanley–McNeil 配对近似;"delong" 使用非参数配对协方差。 |
conf.level |
AUC 差值区间的置信水平。 |
rating_method |
EP24 组内评分相关方法;连续实验室结果默认 Pearson,有序等级可选 Kendall。DeLong 不使用该参数。 |
name |
可选结果名称;省略时由两条曲线名称和方法自动生成。 |
函数只接受同一个 roc 对象中的曲线,从而保证阳性、阴性状态和完整病例完全配对。结果保存在 auc_comparisons[[name]],包含两条 AUC、各自 SE、差值、差值 SE、置信区间、z、P 值及方法专用的相关或协方差信息。summary() 会打印全部已保存比较。
EP24 方法先分别计算阳性组和阴性组内两项评分的相关系数,再取平均,并结合平均 AUC 对 EP24-A2 表 5 作线性插值,得到两个 AUC 估计量之间的相关系数。若坐标超出标准表范围,函数使用最近边界并在结果与控制台中明确标记。DeLong 方法则从阳性和阴性的配对秩贡献直接估计两条 AUC 的协方差,不使用 EP24 查表近似。
12.1.3 概率预测 predict()
代码
predict(
  object,
  mlr = NULL,
  newdata = NULL,
  column_map = NULL
)| 参数 | 说明 |
|---|---|
object |
至少含一个 mlr() 结果的 roc 对象。 |
mlr |
模型名;对象只有一个模型时可省略,多个模型时必须指定。 |
newdata |
新数据框;NULL 时返回共同完整训练数据的拟合结果。 |
column_map |
命名字符向量,名称是新数据列,值是训练模型列,例如 c(new_x1="x1")。 |
设新样本设计向量为 \(\mathbf x_0=(1,x_{01},\ldots,x_{0p})^\mathsf T\),链接尺度预测及其标准误为
\[ \widehat\eta_0=\mathbf x_0^\mathsf T\widehat{\boldsymbol\beta}, \qquad \operatorname{SE}(\widehat\eta_0) =\sqrt{\mathbf x_0^\mathsf T \widehat{\operatorname{Cov}}(\widehat{\boldsymbol\beta})\mathbf x_0}. \]
函数先在 logit 尺度建立
\[ \widehat\eta_0\pm z_{0.975}\operatorname{SE}(\widehat\eta_0), \]
再用 \(\operatorname{logit}^{-1}\) 转回概率尺度得到 ci_lower 和 ci_upper。概率尺度的 pred_se 使用 Delta 法:
\[ \operatorname{SE}(\widehat\pi_0) \approx \operatorname{SE}(\widehat\eta_0) \widehat\pi_0(1-\widehat\pi_0). \]
pred_class 固定为 \(I(\widehat\pi_0\ge0.5)\),当前接口不能改成其他概率阈值。若研究方案使用不同决策阈值,应从 pred_prob 另行按预设规则分类并明确记录。
返回含输入行标识、pred_prob、pred_se、ci_lower、ci_upper 和 pred_class 的数据框。
12.1.4 ROC 绘图和汇总
plot() 不可见地返回 ggplot 对象;summary() 打印并不可见地返回输入的 roc 对象。
代码
plot(x, curves = NULL, cutpoint = NULL,
     type = c("roc", "cutoff"))
summary(x)
curves 与 auc_compare() 使用同一个曲线命名空间:既可以是原始标记物名称,也可以是 MLR 模型名称。plot(x, curves="all") 绘制全部原始标记物和已保存模型;plot(x, curves=c("x1", "combined")) 可混合选择,单独指定 "combined" 则只画该模型。curves=NULL 保持默认只画全部原始标记物。type="cutoff" 只支持在 curves 中指定一个 原始标记物,暂不支持多元模型概率的 cutoff 图。cutpoint 只标注所选原始标记物。summary() 打印全部已保存模型和 auc_compare() 比较结果。
12.2 分析案例
12.2.1 教学数据:两个标记物联合模型
代码
mlr_dat <- as.data.frame(read_csv(
  "./data/012-ROC曲线与多元回归/roc-multimarker.csv",
  show_col_types = FALSE
))
head(mlr_dat)
sid ref x1 x2
1 1 0 5.510540 8.298655
2 2 0 3.188811 12.942968
3 3 0 8.126533 12.351778
4 4 0 6.159571 16.105370
5 5 0 11.118763 11.867919
6 6 0 2.736035 19.585368先在同一共同病例集上计算两个原始标记物的 AUC:
代码
mlr_fit <- roc(
  mlr_dat, cols = c("x1", "x2"),
  reference = "ref", id = "sid"
)
mlr_fit <- auc(mlr_fit)
AUC Table
  Column               AUC          95% CI  Direction
  ------------------------------------------------------------
  x1                0.9219  [0.8712, 0.9727]       geq
  x2                0.8322  [0.7587, 0.9057]       geq
代码
mlr_fit
ROC Analysis
  Data class:        data.frame
  Total rows:        120
  Complete cases:    120
  Reference:         ref (binary)
  Reference coding:  binary (0/1)
  Positive / Neg:    60 / 60
  Evaluation cols:   2  (x1, x2)
  Duplicate IDs:     none

Analysis slots:
    [ ] Describe
    [x] AUC
    [ ] Paired AUC comparison
    [ ] Cutoff
    [ ] MLR
x1 和 x2 的 AUC 分别为 0.9219 和 0.8322;两者方向均为 geq。随后拟合预先指定的双标记物主效应模型:
代码
mlr_fit <- mlr(
  mlr_fit, cols = c("x1", "x2"), name = "combined"
)
Multivariate Logistic Regression (combined)
  --------------------------------------------------
  Formula: reference_binary ~ x1 + x2
  n = 120  (positive = 60, negative = 60)
  AUC = 0.9642  [0.9298, 0.9985]

  Coefficients:
                   Estimate Std. Error   z value     Pr(>|z|)
    (Intercept) -13.6586717  2.7569949 -4.954188 7.263286e-07
    x1            0.7638502  0.1549103  4.930919 8.184356e-07
    x2            0.3949617  0.1064673  3.709700 2.075049e-04

  * Note: AUC is evaluated on the same data used for fitting;
    the estimate may be optimistic.
拟合方程为
\[ \operatorname{logit}(\widehat\pi) =-13.6587+0.76385x_1+0.39496x_2. \]
在另一个标记物不变时,x1 和 x2 每增加一个原始单位的调整优势比分别约为 \(\exp(0.76385)=2.146\) 和 \(\exp(0.39496)=1.484\)。截距的指数通常没有实际意义,因为 \(x_1=x_2=0\) 可能不在数据范围内。
联合模型训练集 AUC 为 0.9642,95% CI 为 0.9298~0.9985。进一步把联合模型分别与两个原始标记物作 EP24 配对比较:
代码
mlr_fit <- auc_compare(
  mlr_fit, curves = c("combined", "x1"), method = "ep24"
)
Paired AUC Comparison
  Curves: combined - x1
  Method: EP24-A2 Hanley-McNeil paired approximation
  Subjects: 120 (positive = 60, negative = 60)
  AUC combined: 0.964167
  AUC x1: 0.921944
  Difference: 0.042222
  SE difference: 0.022111
  95.0% CI: [-0.001115, 0.085559]
  z = 1.909555
  p-value: 0.0561906
  Mean within-group rating correlation: 0.660442
  EP24 area correlation: 0.538934
  Note: fitted training probabilities are treated as fixed scores;
        model optimism and fitting uncertainty are not corrected.
代码
mlr_fit <- auc_compare(
  mlr_fit, curves = c("combined", "x2"), method = "ep24"
)
Paired AUC Comparison
  Curves: combined - x2
  Method: EP24-A2 Hanley-McNeil paired approximation
  Subjects: 120 (positive = 60, negative = 60)
  AUC combined: 0.964167
  AUC x2: 0.832222
  Difference: 0.131944
  SE difference: 0.035277
  95.0% CI: [0.062803, 0.201085]
  z = 3.740275
  p-value: 0.000183819
  Mean within-group rating correlation: 0.445998
  EP24 area correlation: 0.357226
  Note: fitted training probabilities are treated as fixed scores;
model optimism and fitting uncertainty are not corrected.| 比较 | AUC差 | SE | CI下限 | CI上限 | z | P值 |
|---|---|---|---|---|---|---|
| combined - x1 | 0.04222 | 0.02211 | -0.00111 | 0.08556 | 1.90955 | 0.05619 |
| combined - x2 | 0.13194 | 0.03528 | 0.06280 | 0.20109 | 3.74028 | 0.00018 |
这些比较解决了同一受试者所致的曲线相关性,但联合概率仍由这 120 例资料拟合,配对检验没有校正模型拟合不确定性或乐观偏倚,也没有完成验证集评价,不能表述为已经证实的临床增益。
代码
plot(mlr_fit, curves = "all")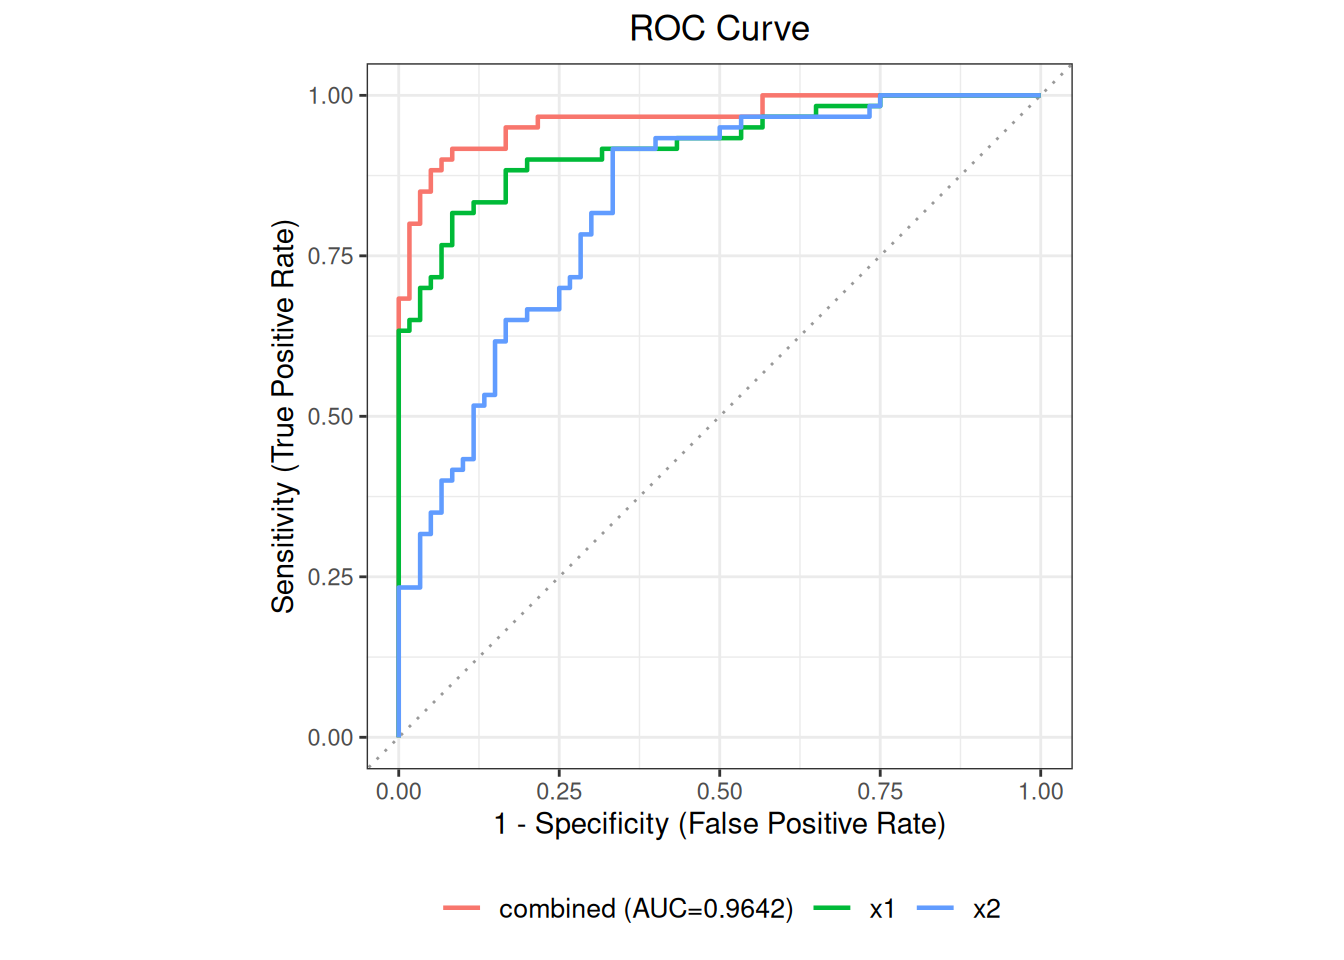
新样本预测与列名映射
代码
new_patients <- data.frame(
  x1 = c(7, 12),
  x2 = c(16, 21)
)
new_predictions <- predict(
  mlr_fit, mlr = "combined", newdata = new_patients
)
new_predictions
x1 x2 pred_prob pred_se ci_lower ci_upper pred_class
1 7 16 0.1200103 0.05313595 0.04840777 0.2677265 0
2 12 21 0.9781557 0.01751040 0.89984790 0.9955390 1两例预测概率分别为 0.1200 和 0.9782,按内置 0.5 阈值分别显示为 0 和 1。区间反映拟合平均概率的参数不确定性,不包含新个体结局本身的二项随机性,也不包含模型错误和人群迁移。
新数据列名不同时,映射方向是“新列名 = 训练列名”:
代码
renamed_patients <- data.frame(
  marker_a = c(7, 12),
  marker_b = c(16, 21)
)
mapped_predictions <- predict(
  mlr_fit,
  mlr = "combined",
  newdata = renamed_patients,
  column_map = c(marker_a = "x1", marker_b = "x2")
)
12.2.2 CLSI EP24-A2 附录 D:两条配对 ROC
EP24 附录 D 的 OxLDL 和 LDL 都来自同一组 50 名受试者,因此两条 AUC 相关。先在同一个 roc 对象中计算两条经验 AUC 及单曲线 Hanley–McNeil 区间,再调用 auc_compare();函数由共同完整病例保证配对关系。
代码
ep24_pair <- as.data.frame(read_csv(
  "./data/公共/std-ep24-appendix-d.csv",
  show_col_types = FALSE
))
ep24_pair_fit <- roc(
  ep24_pair, cols = c("oxldl", "ldl"),
  reference = "diagnosis", id = "id"
)
ep24_pair_fit <- auc(ep24_pair_fit)
AUC Table
  Column               AUC          95% CI  Direction
  ------------------------------------------------------------
  oxldl             0.7995  [0.6777, 0.9213]       geq
  ldl               0.5617  [0.4012, 0.7222]       geq
代码
ep24_pair_fit
ROC Analysis
  Data class:        data.frame
  Total rows:        50
  Complete cases:    50
  Reference:         diagnosis (binary)
  Reference coding:  binary (0/1)
  Positive / Neg:    28 / 22
  Evaluation cols:   2  (oxldl, ldl)
  Duplicate IDs:     none

Analysis slots:
    [ ] Describe
    [x] AUC
    [ ] Paired AUC comparison
    [ ] Cutoff
    [ ] MLR
默认的 EP24 方法按标准式(6)计算
\[ \operatorname{SE}(\widehat A_1-\widehat A_2) =\sqrt{\operatorname{SE}_1^2+\operatorname{SE}_2^2 -2r\operatorname{SE}_1\operatorname{SE}_2}, \]
其中 \(r\) 是由阳性、阴性组内评分相关的平均值和平均 AUC 对 EP24 表 5 插值得到的 AUC 相关。DeLong 方法不使用这项查表近似,而是通过每名阳性和阴性受试者的配对秩贡献估计协方差:
定义
\[ \phi(x,y)=I(x>y)+\frac12I(x=y), \]
对第 \(k\) 个标记物、\(m\) 个阳性和 \(n\) 个阴性,建立
\[ V_{10,i}^{(k)}=\frac1n\sum_{j=1}^{n}\phi(X_{ki},Y_{kj}), \qquad V_{01,j}^{(k)}=\frac1m\sum_{i=1}^{m}\phi(X_{ki},Y_{kj}). \]
两个标记物 AUC 向量的 DeLong 协方差估计为
\[ \widehat{\boldsymbol\Sigma} =\frac{\operatorname{Cov}(\mathbf V_{10})}{m} +\frac{\operatorname{Cov}(\mathbf V_{01})}{n}. \]
令 \(\mathbf c=(1,-1)^\mathsf T\),则差值 \(\widehat\Delta=\widehat A_{\mathrm{OxLDL}}-\widehat A_{\mathrm{LDL}}\) 的标准误为
\[ \operatorname{SE}(\widehat\Delta) =\sqrt{\mathbf c^\mathsf T\widehat{\boldsymbol\Sigma}\mathbf c}. \]
代码
ep24_pair_fit <- auc_compare(
  ep24_pair_fit,
  curves = c("oxldl", "ldl"),
  method = "ep24"
)
Paired AUC Comparison
  Curves: oxldl - ldl
  Method: EP24-A2 Hanley-McNeil paired approximation
  Subjects: 50 (positive = 28, negative = 22)
  AUC oxldl: 0.799513
  AUC ldl: 0.561688
  Difference: 0.237825
  SE difference: 0.075261
  95.0% CI: [0.090315, 0.385334]
  z = 3.159979
  p-value: 0.0015778
  Mean within-group rating correlation: 0.511818
  EP24 area correlation: 0.481818
  Table lookup used bounded coordinates: correlation 0.5118, AUC 0.7000
把现场计算值与检查表中的 EP24 公布值比较:
| 标准位置 | 统计量 | 标准结果 | ivdtools结果 |
|---|---|---|---|
| OxLDL | AUC | 0.8000 | 0.799513 |
| OxLDL | SE | 0.0620 | 0.062140 |
| OxLDL | CI_lower | 0.6800 | 0.677718 |
| OxLDL | CI_upper | 0.9200 | 0.921308 |
| LDL | AUC | 0.5600 | 0.561688 |
| LDL | SE | 0.0820 | 0.081895 |
| LDL | CI_lower | 0.4000 | 0.401174 |
| LDL | CI_upper | 0.7200 | 0.722203 |
| Difference | AUC_difference | 0.2400 | 0.237825 |
| Difference | SE | 0.0750 | 0.075261 |
| Difference | CI_lower | 0.0900 | NA |
| Difference | CI_upper | 0.3900 | NA |
| Difference | z | 3.1600 | 3.159979 |
| Difference | p_value | 0.0016 | 0.001578 |